
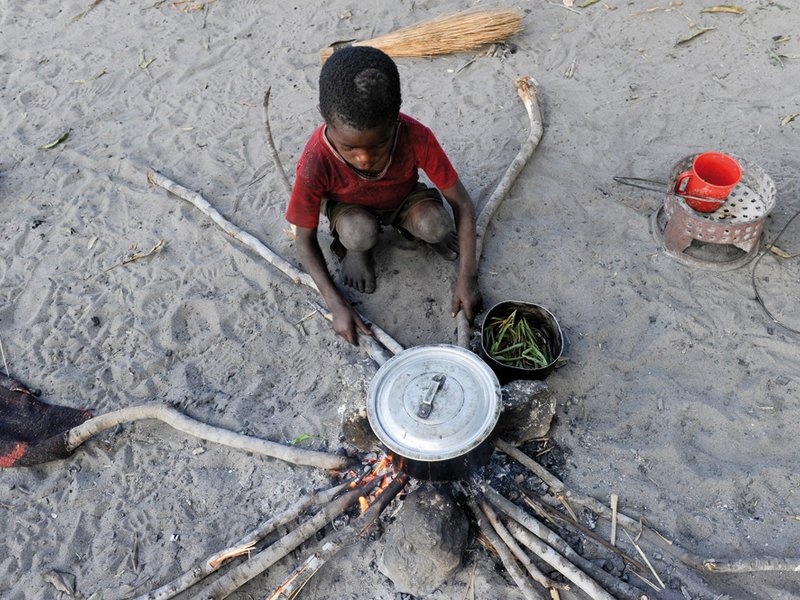
Marginality is multifaceted and much more broadly defined than poverty.
Photo: J. Boethling
 Download this article in magazine layout
- Share this article
- Subscribe to our newsletter
Mapping hotspots of marginality for area identification
Marginality is one of our core research programmes which focuses on people living at the edge of society and having no or limited access to markets or networks to fulfil their basic needs. Through hotspot mapping, poor and marginal areas can be identified where innovations in agricultural technologies could potentially improve rural livelihoods faced by degrading soils, lack of capital or limited access to markets. By mapping regions with low endowments of important factors of a livelihood, we are highlighting areas where more research is necessary to improve rural lives, especially in cases where they can be enhanced by better agricultural productivity.
The dimensions of marginality
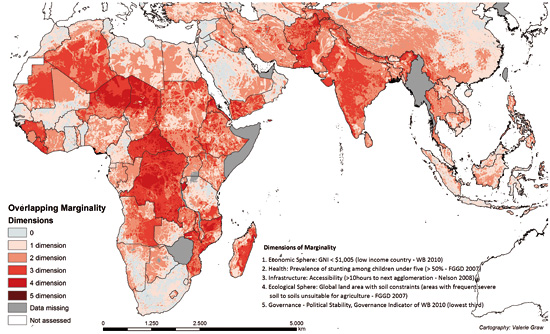
Marginality is not equal to poverty. It is more about the underlying causes of poverty. Referring to Gatzweiler et al. 2011, Graw & Ladenburger (2012) described different dimensions of marginality represented by an economic, demographic, quality of life, landscape design, infrastructure, ecological and a public domain dimension. For each of these dimensions one representative indicator was chosen. The indicators within the dimensions of marginality are furthermore defined by cut-off points of the certain variable. An area is stated to be marginal below or above the chosen cut-off point, depending on the indicator. Within the same study, the cut-off points were chosen by literature review and country statistics to find the areas which tended to be marginal.
The economic variable was represented by Gross National Income (GNI) per capita. According to the World Bank Atlas Method, an economy is referred to as a “low economy” if the GNI per capita is below 1,005 US dollars a year (World Bank 2011), which we therefore used as cut-off point. The health dimension was represented by prevalence of stunting (low height for age) among children under five, showing chronic malnourishment.
To measure infrastructure and accessibility, we chose a dataset generated by Nelson (2009) showing travel time to the next agglomeration of 20,000 people. As it was difficult to answer the question “How far is far” we used the least third quantile to represent the marginal dimension of accessibility. A dataset by FGGD (Food Insecurity, Poverty and Environmental Global GIS Database) on global land areas with soil constraints was used to identify areas with frequent severe soils for agriculture and areas which are unsuitable for agriculture. This dataset was used for the representation of the ecological sphere. For the public domain dimensions, we focused on the aspect of governance which could best be represented by political stability, also a governance indicator of the World Bank, as it is one of the variables which “measures the perception of the likelihood that the government will be destabilised by unconstitutional or violent means” (Thomas 2010).
Linking marginality to poverty
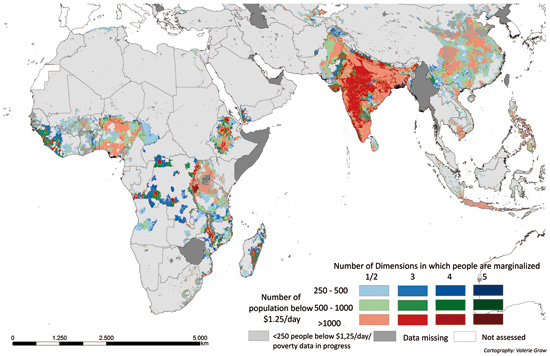
By overlaying the different dimensions – based on the cut-off-points – we were able to identify in how many dimensions an area was marginal (map below). In a second approach, we took a closer look at how many poor people were living in these hotspots and were therefore affected by marginality and poverty. As we wanted to focus on the number of poor and marginalised, we preferred poverty mass instead of poverty rates.
A dataset provided by Harvest Choice was used to overlay poverty mass with marginality hotspots (map below). We found marginality hotspots in India and Bangladesh as well as in East and West Africa. This analysis of marginality hotspots is important to contribute to our partners’ work in our partner countries. The TIGA project (Technology assessment and farm household segmentation for inclusive poverty reduction and sustainable productivity growth in agriculture) now uses this approach on a subnational scale with a focus on four partner countries: Ethiopia, Ghana, Bangladesh and India (the two states of Bihar and Odisha).
Valerie Graw
PhD Researcher Center for Development Research (ZEF)
University of Bonn, Germany
valerie.graw@uni-bonn.de
References/Sources for further reading
The authors’s research information: http://www.zef.de/staff/1004.html
Center for Development Research: http://www.zef.de
FGGD: http://geonetwork3.fao.org/fggd
Gatzweiler et al. 2011: http://www.zef.de/module/register/media/b235_WP%2077_gatzweiler%20et%20al.pdfand
Graw & Ladenburger 2012: http://www.zef.de/fileadmin/webfiles/downloads/zef_wp/wp88.pdf
Harvest Choice: http://harvestchoice.org/topics/income-and-poverty
IFAD 2011: http://www.ifad.org/rpr2011/report/e/rpr2011.pdf
MARGIP-Project: http://www.zef.de/margip.html
Nelson 2009: http://bioval.jrc.ec.europa.eu/products/gam/index.htm
Thomas 2010: http://www.palgrave-journals.com/ejdr/journal/v22/n1/pdf/ejdr200932a.pdf
TIGA-Project: www.zef.de/project_tiga.html
World Bank 2011: http://data.worldbank.org/about/country-classifications/world-bank-atlas-method
News Comments
Current Print Issue

Add a comment
Be the First to Comment