
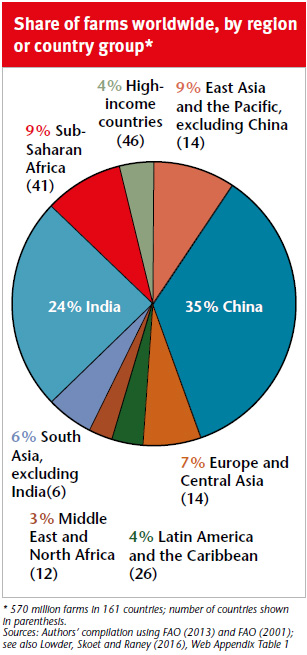
35 per cent of all farms are in China.
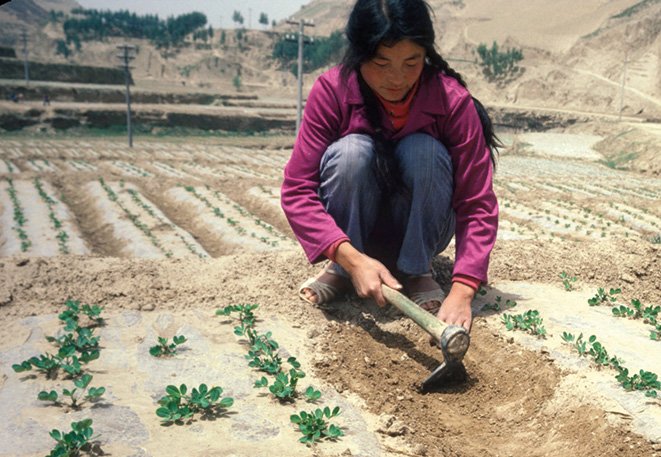
Photo: FAO/F. Botts
 Download this article in magazine layout
- Share this article
- Subscribe to our newsletter
The evolution of global farmland distribution
In order to better understand rural transformation, it is important to know how average farm size and farmland distribution have changed over time in each region of the world. This is above all also interesting with regard to what might be expected when countries move to higher levels of economic development. First of all, however, we have to define more precisely what we mean by “farm”.
In our work, we used the agricultural holding as defined in the World Census of Agriculture (WCA) guidelines, according to which an agricultural holding comprises the “units of crop and livestock production which are under single management (regardless of ownership) by either an individual or group of individuals, a household or several households, clan or tribe, corporation, cooperative or government entity” (FAO, 2005). We defined the farmer as the agricultural holder, that is, the person who makes strategic decisions regarding use of the farm resources and who bears all risks associated with the farm, but who may not necessarily assume day-to-day work management responsibilities.
The surveys in 167 countries have revealed that there are more than 570 million farms in the world. Only 4 per cent of them are located in high-income countries, while the vast majority (74 per cent) are in Asia (see below). China alone represents 35 per cent and India 24 per cent of the world’s farms. Nine per cent are found in sub-Saharan Africa and 7 per cent in Europe and Central Asia. Farms in Latin America and the Caribbean represent 4 per cent of farm holdings world-wide. Only 3 per cent are located in the Middle East and North Africa.
Many countries have only conducted a single agricultural census or their agricultural census reports lack information on farmland distribution, so we cannot consider the change in farmland distribution over time at global level. We were however able to analyse data from a sample of 106 countries (which represents a large share of the world’s agricultural Gross Domestic Product [GDP] and population) and for which data on farm size and farmland distribution are available to provide estimates for the world and by region and income levels. This allows inferences to be made regarding what might be expected as incomes grow and countries move to higher levels of economic development.
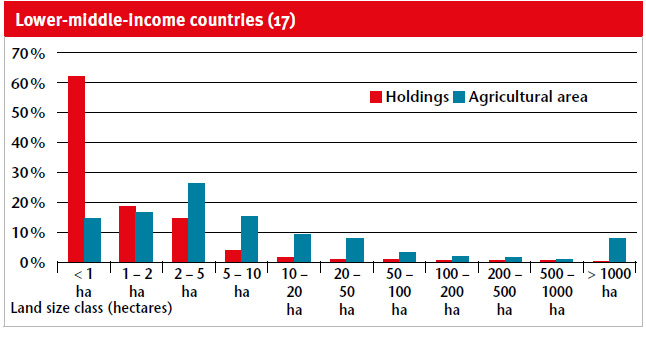
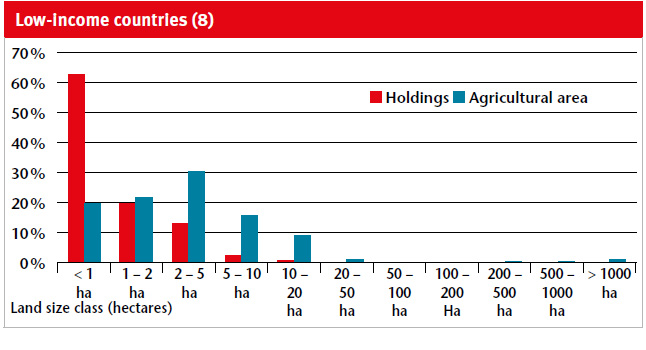
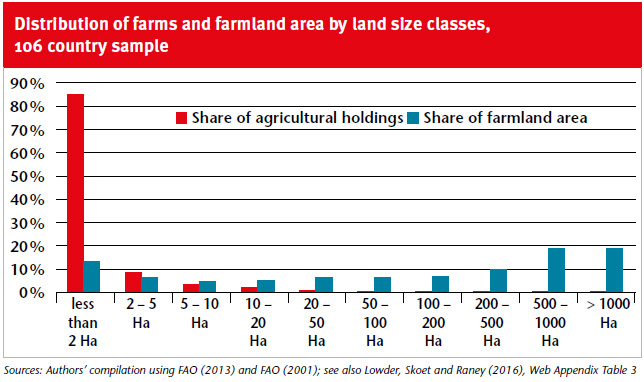
Globally, about 84 per cent of farms are smaller than two hectares, and these farms operate around twelve per cent of farmland (see Figure above). In other words, only 16 per cent of the world’s farms are larger than two hectares, but they represent 88 per cent of the world’s farmland. Considering farmland distribution by income group, we see that smaller farms operate a far greater share of farmland in lower-income countries and regions than in higher-income countries and regions (note that this includes 87 countries for which we have tabulations of the number of farms as well as farmland distribution by farm size; as a result, China is among those countries excluded from the Figure on the left). In the low- and lower-middle income countries (which are located primarily in East Asia and the Pacific, South Asia and sub-Saharan Africa), about 80 per cent of farms are smaller than two hectares, similar to the global average, but they operate a much larger share of land, about 40 per cent.
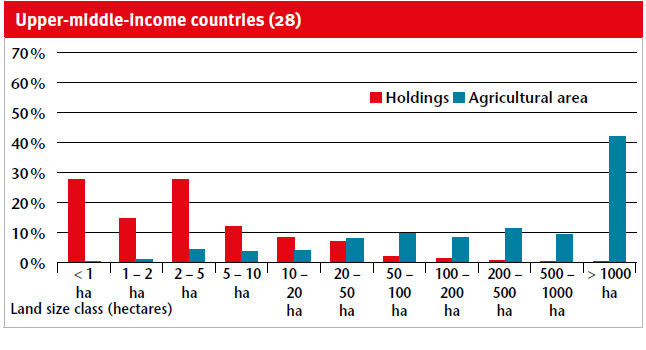
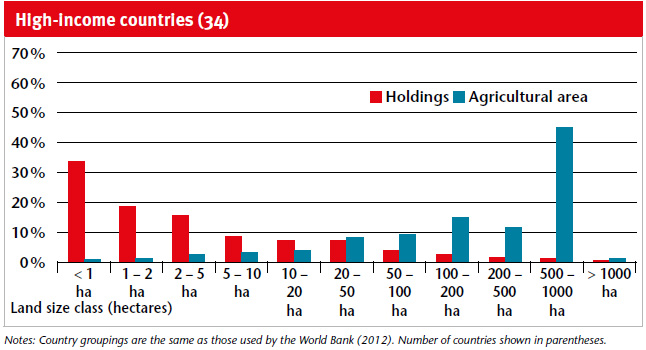
In upper-middle-income countries which are primarily located in Latin America and the Caribbean and the Middle East and North Africa, and in high-income countries, only about 40 to 50 per cent of farms are smaller than two hectares in size, and they operate less than five per cent of farmland. This pattern suggests that the share of farmland managed by small farms decreases as average income levels rise. That is, it suggests that farms consolidate as economies develop.
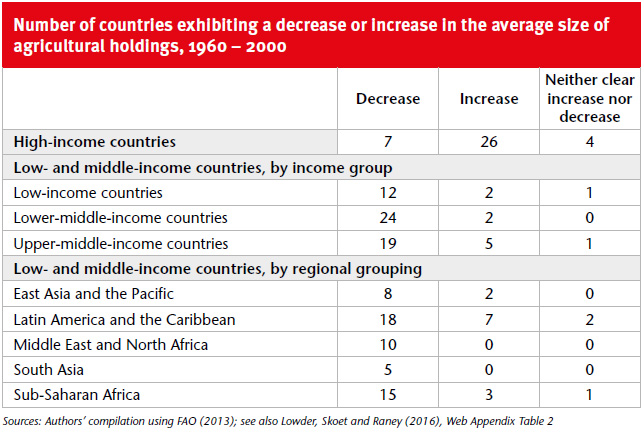
As noted above, many countries only have one agricultural census, or their agricultural census reports lack information on farmland distribution, but considering average farm sizes for countries for which estimates of average farm size are available for at least two of the census periods from 1960 to 2000, we see clear patterns according to income group (see Table below). In most low- and lower-middle-income countries, average farm sizes have decreased. A slightly larger share of upper-middle-income countries have exhibited increasing average farm size, and the majority of high-income countries have seen a clear increase. Patterns according to regional groupings of low- and middle-income countries show that an increase in average farm size has occurred in some (mostly upper-middle-income) countries in Latin America and the Caribbean, but in few countries in other regions.
In summary, the following key findings can be deduced from this data:
- There are more than 570 million farms in the world.
- 84 per cent of the world’s farms are smaller than two hectares and they operate only 12 per cent of world farmland.
- In countries at lower levels of income, smaller farms operate a far greater share of farmland than in the higher-income countries.
- Average farm size has decreased in most low and lower-middle income countries and increased in some upper-middle income and in most high-income countries.
- The trends in average farm size as well as the distribution of farmland by farm size for countries at varying levels of development are both suggestive of farm consolidation as economies grow and of fragmentation in low-income slow-growth countries.
Furthermore, the surveys indicate that there is room to improve data. Continued efforts to enhance the collection of up-to date, comprehensive and more standardised agricultural census data are essential to having a more representative picture of the agricultural sector world-wide. It would seem appropriate to redouble efforts to make farm-level agricultural census data more easily accessible to researchers as well as to encourage all countries to conduct comprehensive agricultural censuses which either sample or enumerate all types of farms throughout a country. For countries that limit agricultural censuses to a survey of household farms only, the international community might consider conducting supplementary surveys to consider corporate and government owned enterprises as well as household farms.
The views expressed in this publication are those of the authors and do not necessarily reflect the views or policies of FAO.
Sarah K. Lowder, Jakob Skoet
Agricultural and Development
Economics Division
Terri Raney
Sub-regional Office for the Caribbean
Food and Agriculture Organization of
the United Nations (FAO)
Rome, Italy / Port of Spain, Trinidad
and Tobago
Contact: Sarah.Lowder@fao.org
Background and data collection
The best available data for an analysis of the number, size and distribution of farmland are collected through the Programme for the World Census of Agriculture (WCA). The Food and Agriculture Organization of the United Nations (FAO) has promoted the WCA since 1950 by providing governments with guidance on standard methodology and contents for their agricultural censuses, and new agricultural census reports are constantly being made available. FAO’s State of Food and Agriculture 2014: Innovation in Family Farming analysed agricultural census reports to provide the most comprehensive overview to date of the number, size and distribution of farms and farmland for countries around the world by income level and regional group. This article summarises key results of this work.
For the number of agricultural holdings the authors recorded the most recent estimate for each country or territory for which an agricultural census had been carried out and for which a report was available (most estimates are from the 2010 agricultural census round, although some are as old as 1960).
Data from 167 countries were used to estimate the number of farms world-wide. These countries represent 96 per cent of the world’s population, 97 per cent of the population active in agriculture and 90 per cent of agricultural land world-wide. The resultant estimate of the total number of farms in the 167 countries came to nearly 570 million. For many reasons, including a lack of estimates for about 40 countries and the fact that many of the estimates for lower-income countries are quite old, we expect that the actual number of farms in the world may be larger than this 570 million estimate. For distribution of farms and farmland world-wide, as well as changes in farm size over time, the sample included just over 100 countries which are largely representative of the world’s agricultural population.
Agricultural holdings and agricultural area reported by the censuses include crop and livestock production only; holdings engaged in forestry or fisheries are only covered if they are also engaged in crop and livestock production. Communal lands are generally not included in the agricultural censuses.
References and further reading
- FAO (2001): Supplement to the Report on the 1990 World Census of Agriculture. FAO Statistical Development Series 9a. Rome: FAO.
- FAO (2005): A System of Integrated Agricultural Censuses and Surveys Volume 1 World Programme for the Census of Agriculture 2010: FAO Statistical Development Series 11. Rome: FAO.
- FAO (2013): 2000 World Census of Agriculture Methodological Review (1996– 2005): FAO Statistical Development Series 14. Rome: FAO.
- FAO (2014): The State of Food and Agriculture 2014: Innovation in family farming. Rome: FAO. Available at: http://www.fao.org/publications/sofa/en
- FAO (2016): World Programme for the Census of Agriculture. Available at: www.fao.org/economic/ess/ess-wca/en/
- Lowder, Sarah, Jakob Skoet and Terri Raney, in press: “The Number, size and distribution of farms, smallholder farms and family farms worldwide.” World Development. Available at: http://www.sciencedirect.com/science/article/pii/S0305750X15002703
- World Bank (2012) World Development Indicators. Availabble at: http://databank.worldbank.org )
News Comments
Current Print Issue


Add a comment
Be the First to Comment